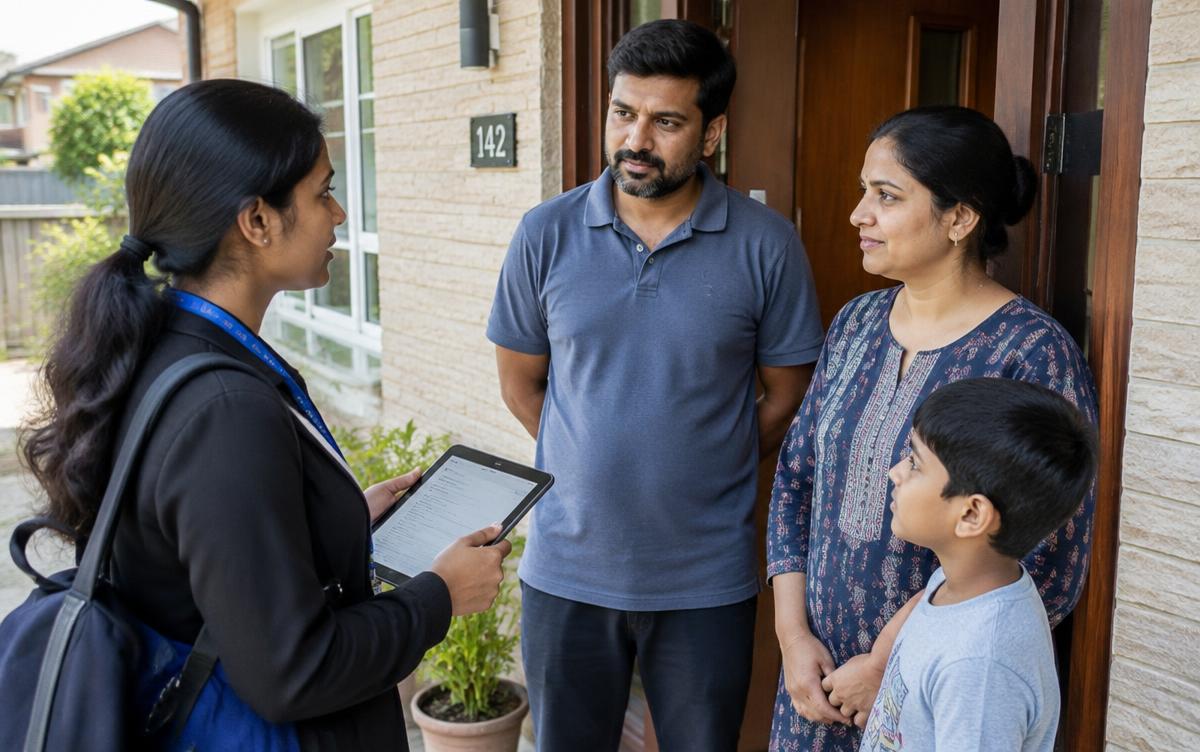
Quantitative research
Quantitative Surveys in India
Statistically robust surveys with sound sampling designs across urban and rural India.
Quick answer
Quantitative Surveys is the right instrument when the job is producing numbers that survive scrutiny. A typical study runs 400–5,000 completes over 3–6 weeks and gives you measured incidence with a stated margin of error.
Proposal in 24 hours
Scoped, itemised and fixed-fee.
50 cities, 14 languages
Our own supervised field teams.
Senior-led, NDA-first
A research director on every project.
2,400+
Projects delivered
50
Cities with field teams
30
Industries covered
14
Indian languages
01
The decisions this study answers
Commission this when one of the questions below is holding up a decision. If your question is not on the list, say so in the brief — we would rather recommend a different method than sell you this one.
What share of the market holds this behaviour or opinion, and within what margin?
Is the difference between these two segments real, or inside the noise?
How has the measure moved since the last wave?
Which subgroups are large enough to build a plan around?
What does the population look like once the sample is weighted properly?
02
How we run it
5 stages, with one research director accountable across all of them. The person who scopes the study is the person who presents the findings.
- 1
Set the sampling design first
Stratification, cluster selection and the smallest reportable subgroup are agreed before the questionnaire, because they determine the sample size.
- 2
Script and translate
Routing, quotas and range checks are built into the CAPI script, then the instrument is translated, back-translated and cognitively piloted.
- 3
Field with live quota control
Supervised teams work assigned starting points and skip patterns, with the quota grid refreshed every evening so gaps are closed, not padded.
- 4
Clean and weight
Logic, outlier and back-check failures are removed, then data is weighted to the census or to your own universe estimates.
- 5
Test and report
Differences are tested for significance before anyone calls them a finding, and tables ship with the weighting scheme documented.
03
At a glance
Quantitative Surveys — typical study parameters
- Typical scale
- 400 to 5,000 completes, with sample sizes set by the smallest subgroup you need to report
- Fieldwork window
- Three to six weeks depending on incidence and geography
- Lead time
- Scripting and translation take five days; field opens in week two
- Coverage
- All 50 cities plus rural clusters, with CAPI in field and PAPI where devices are impractical
- Languages
- Instrument translated and back-translated into every field language before piloting
- Core methods
- CAPI · PAPI · Stratified sampling · Weighting
- Reporting
- Clean SPSS and Excel datasets, banner tables, significance testing and a findings deck
- Best suited to
- Producing numbers that survive scrutiny
04
What you receive
3 named deliverables, each written to be used rather than filed. Everything ships with the underlying data, so your team can keep working after the debrief.
Data tables
Banner tables built to your reporting cuts, with base sizes and significance marks on every cell.
Dashboards
An interactive dashboard with filters on the subgroups your teams actually argue about.
Significance testing
Significance testing applied consistently, so the report distinguishes a real movement from sampling noise.
05
How the fieldwork is validated
Fieldwork in India fails quietly when nobody checks it. These controls are run on every quantitative surveys study, by a quality team that reports separately from the field team.
GPS and duration stamps on every interview
Each tablet record carries a location and a length. Interviews that are too short, or clustered at one convenient address, are pulled before they reach the dataset.
Twenty per cent audio back-checks
A fifth of all interviews are re-contacted or audio-reviewed by a quality team that does not report to the field supervisor who ran them.
One supervisor to six interviewers
Supervisors accompany each interviewer at least twice a week and sit through the full interview, not the doorstep introduction.
Translation and independent back-translation
Every instrument is translated into the field language, back-translated into English by a second linguist, then piloted before launch.
Random starting points, not convenience routes
Household selection follows a prescribed random walk from an assigned starting point, which is what keeps an urban sample from becoming a main-road sample.
Method choice
Quantitative Surveys, or one of these instead?
Most briefs can be answered more than one way, and the wrong instrument is the most expensive mistake in research. Here is how quantitative surveys compares with the two methods buyers most often weigh against it.
| Quantitative Surveys | CATI Telephone Surveys | Online Surveys | |
|---|---|---|---|
| Best used for | Producing numbers that survive scrutiny | Reaching a dispersed sample quickly | Speed, volume and anything needing visual stimulus |
| Typical scale | 400–5,000 completes | 300–3,000 completes | 300–10,000 completes |
| Fieldwork window | 3–6 weeks | 1–3 weeks | 3 days–2 weeks |
| Evidence produced | Measured incidence with a stated margin of error | Fast, monitored, national numbers | Large samples with advanced designs built in |
| Projects to a population | |||
| Relative cost | Scales with sample and incidence | Lower than face to face | Lowest per complete |
Where this method stops
City coverage
Where this work is strongest
We field in all 50 cities, but these are the markets where this method has the most to offer — because of the infrastructure, the respondent base or the sectors concentrated there.
Tier 1 · Maharashtra
Mumbai
Ward-level sampling frames covering every zone of the city. Depth in Banking & Financial Services and Media & Entertainment, with work running in Marathi, Gujarati, Hindi and English.
ViewTier 1 · Delhi
Delhi NCR
Ward-level sampling frames covering every zone of the city. Depth in Government & Social Sector and Retail, with work running in Hindi, Punjabi and English.
ViewTier 1 · Karnataka
Bangalore
Ward-level sampling frames covering every zone of the city. Depth in Information Technology & SaaS and E-commerce & Quick Commerce, with work running in Tamil, Telugu, Kannada, Malayalam and English.
ViewTier 1 · Tamil Nadu
Chennai
Ward-level sampling frames covering every zone of the city. Depth in Automotive and Manufacturing & Industrial, with work running in Tamil, Telugu, Kannada, Malayalam and English.
ViewTier 1 · Telangana
Hyderabad
Ward-level sampling frames covering every zone of the city. Depth in Pharmaceuticals and Information Technology & SaaS, with work running in Tamil, Telugu, Kannada, Malayalam and English.
ViewTier 1 · West Bengal
Kolkata
Ward-level sampling frames covering every zone of the city. Depth in FMCG and Logistics & Supply Chain, with work running in Bengali, Odia, Hindi and English.
ViewTier 1 · Maharashtra
Pune
Ward-level sampling frames covering every zone of the city. Depth in Automotive and Information Technology & SaaS, with work running in Marathi, Gujarati, Hindi and English.
ViewTier 1 · Gujarat
Ahmedabad
Ward-level sampling frames covering every zone of the city. Depth in Chemicals & Specialty Materials and Pharmaceuticals, with work running in Marathi, Gujarati, Hindi and English.
View
Before you brief us
Frequently asked questions
How long does a quantitative surveys project take?
Three to six weeks depending on incidence and geography. Scripting and translation take five days; field opens in week two. Analysis and reporting add a further one to two weeks, so most studies close inside six to ten weeks from brief to debrief.
What sample size do you recommend?
400 to 5,000 completes, with sample sizes set by the smallest subgroup you need to report. The right number is set by the smallest subgroup you need to report separately, not by a round figure, and we will say when a smaller sample would answer the question just as well.
What drives the cost of quantitative surveys in India?
Incidence and audience difficulty first, then scale, the number of cities and languages, and the depth of reporting. Relative to other methods on this site, the cost profile is: scales with sample and incidence. Send a brief and you get a fixed-fee proposal within 24 hours.
When is quantitative surveys the wrong choice?
A survey confirms what you already suspect exists. It is a poor instrument for discovering something you did not think to ask about.
How do you control quality in the field?
Each tablet record carries a location and a length. Interviews that are too short, or clustered at one convenient address, are pulled before they reach the dataset. Beyond that, random starting points, not convenience routes: household selection follows a prescribed random walk from an assigned starting point, which is what keeps an urban sample from becoming a main-road sample.
Can international teams commission this from outside India?
Yes. We report in English, run calls across US, European and Asian time zones, and handle local-language fieldwork and translation end to end.
Study at a glance
- Discipline
- Quantitative
- Typical scale
- 400–5,000 completes
- Field window
- 3–6 weeks
- Projectable
- Yes
- Relative cost
- Scales with sample and incidence
- Cities covered
- 50
Keep exploring
Everything built on this method
8 metros, 42 Tier 2 markets, 30 sectors and 15 guides, each applying quantitative surveys to one specific context.
Tier 1 metros
8Full-scale fieldwork, viewing facilities and senior decision-maker access.
- Quantitative Surveys in MumbaiMaharashtra
- Quantitative Surveys in Delhi NCRDelhi
- Quantitative Surveys in BangaloreKarnataka
- Quantitative Surveys in ChennaiTamil Nadu
- Quantitative Surveys in HyderabadTelangana
- Quantitative Surveys in KolkataWest Bengal
- Quantitative Surveys in PuneMaharashtra
- Quantitative Surveys in AhmedabadGujarat
Tier 2 markets
42Each city covered from a local field base that also reaches the surrounding districts.
- Quantitative Surveys in JaipurRajasthan
- Quantitative Surveys in LucknowUttar Pradesh
- Quantitative Surveys in KanpurUttar Pradesh
- Quantitative Surveys in NagpurMaharashtra
- Quantitative Surveys in IndoreMadhya Pradesh
- Quantitative Surveys in BhopalMadhya Pradesh
- Quantitative Surveys in SuratGujarat
- Quantitative Surveys in VadodaraGujarat
Show 34 more
- Quantitative Surveys in RajkotGujarat
- Quantitative Surveys in NashikMaharashtra
- Quantitative Surveys in AurangabadMaharashtra
- Quantitative Surveys in CoimbatoreTamil Nadu
- Quantitative Surveys in MaduraiTamil Nadu
- Quantitative Surveys in KochiKerala
- Quantitative Surveys in ThiruvananthapuramKerala
- Quantitative Surveys in VisakhapatnamAndhra Pradesh
- Quantitative Surveys in VijayawadaAndhra Pradesh
- Quantitative Surveys in MysoreKarnataka
- Quantitative Surveys in MangaloreKarnataka
- Quantitative Surveys in Hubli-DharwadKarnataka
- Quantitative Surveys in ChandigarhChandigarh
- Quantitative Surveys in LudhianaPunjab
- Quantitative Surveys in AmritsarPunjab
- Quantitative Surveys in JalandharPunjab
- Quantitative Surveys in DehradunUttarakhand
- Quantitative Surveys in AgraUttar Pradesh
- Quantitative Surveys in VaranasiUttar Pradesh
- Quantitative Surveys in PrayagrajUttar Pradesh
- Quantitative Surveys in MeerutUttar Pradesh
- Quantitative Surveys in NoidaUttar Pradesh
- Quantitative Surveys in GurugramHaryana
- Quantitative Surveys in FaridabadHaryana
- Quantitative Surveys in GhaziabadUttar Pradesh
- Quantitative Surveys in PatnaBihar
- Quantitative Surveys in RanchiJharkhand
- Quantitative Surveys in BhubaneswarOdisha
- Quantitative Surveys in RaipurChhattisgarh
- Quantitative Surveys in GuwahatiAssam
- Quantitative Surveys in JammuJammu & Kashmir
- Quantitative Surveys in GoaGoa
- Quantitative Surveys in JodhpurRajasthan
- Quantitative Surveys in UdaipurRajasthan
By industry
30The same method applied to one sector’s audiences, vocabulary and buying process.
- FMCG quantitative surveys
- Healthcare quantitative surveys
- Pharmaceuticals quantitative surveys
- Banking & Financial Services quantitative surveys
- Insurance quantitative surveys
- Automotive quantitative surveys
- Electric Vehicles quantitative surveys
- Real Estate quantitative surveys
Show 22 more
- Education & EdTech quantitative surveys
- Retail quantitative surveys
- E-commerce & Quick Commerce quantitative surveys
- Telecom quantitative surveys
- Information Technology & SaaS quantitative surveys
- Energy & Renewables quantitative surveys
- Agriculture & Agritech quantitative surveys
- Manufacturing & Industrial quantitative surveys
- Hospitality & Tourism quantitative surveys
- Food & Beverage quantitative surveys
- Consumer Durables & Electronics quantitative surveys
- Fashion & Apparel quantitative surveys
- Media & Entertainment quantitative surveys
- Logistics & Supply Chain quantitative surveys
- Chemicals & Specialty Materials quantitative surveys
- Construction & Infrastructure quantitative surveys
- Beauty & Personal Care quantitative surveys
- Fintech quantitative surveys
- Gaming & Esports quantitative surveys
- Aviation & Airports quantitative surveys
- Medical Devices quantitative surveys
- Government & Social Sector quantitative surveys
Guides and pricing
15Cost drivers, briefing checklists and buyer guides written for this method.
- How Much Does Quantitative Surveys Cost in India? A Pricing Guide4 min
- Quantitative Surveys in India: The Complete Guide4 min
- How to Choose a Quantitative Surveys Agency in India4 min
- Quantitative Surveys Checklist: 12 Steps Before You Commission a Study4 min
- 7 Costly Quantitative Surveys Mistakes Brands Make in India4 min
- Quantitative Surveys Sample Size and Sampling Guide for India4 min
- How Long Does Quantitative Surveys Take? Project Timelines Explained4 min
- Quantitative Surveys for Foreign Companies Entering India4 min
Show 7 more
- Quantitative Surveys in Tier 2 and Tier 3 India: How to Get It Right4 min
- Quantitative Surveys for Startups: Getting Evidence on a Budget4 min
- How to Write a Quantitative Surveys Brief (Free Template)4 min
- In-House vs Agency Quantitative Surveys: Which Is Right for You?4 min
- Measuring the ROI of Quantitative Surveys4 min
- Quantitative Surveys by Industry: Use Cases from FMCG to Healthcare4 min
- Quantitative Surveys: 10 Questions to Ask Before You Hire a Research Firm4 min
Other quantitative methods
8Closest alternatives, where a different instrument may answer the question better.
Every other service
11The full method set, from qualitative immersion to strategic modelling.
Next step
Ready to scope a quantitative surveys study?