Specialist research
Retail Audit & Distribution in India
Measure availability, visibility and share of shelf in general and modern trade.
Quick answer
Market Research India runs retail audit & distribution across India: 200–3,000 outlets, 2–4 weeks per wave in field, and numeric and weighted distribution, out-of-stock reporting and visibility scores by channel.
Proposal in 24 hours
Scoped, itemised and fixed-fee.
50 cities, 14 languages
Our own supervised field teams.
Senior-led, NDA-first
A research director on every project.
2,400+
Projects delivered
50
Cities with field teams
30
Industries covered
14
Indian languages
01
The decisions this study answers
Commission this when one of the questions below is holding up a decision. If your question is not on the list, say so in the brief — we would rather recommend a different method than sell you this one.
What is our real numeric and weighted distribution by channel?
Where are we out of stock, and how much does that cost us each month?
Is our share of shelf matching our share of market?
Are planogram and visibility agreements actually being honoured?
Which competitor is gaining shelf in which towns, and how quickly?
02
How we run it
5 stages, with one research director accountable across all of them. The person who scopes the study is the person who presents the findings.
- 1
Build a representative outlet panel
Outlets are sampled by channel, class and geography to mirror the real universe, then held constant so month-on-month movement is readable.
- 2
Standardise the audit form
SKU lists, facings definitions and planogram criteria are fixed, so two auditors in two states record the same shelf identically.
- 3
Audit with photographic capture
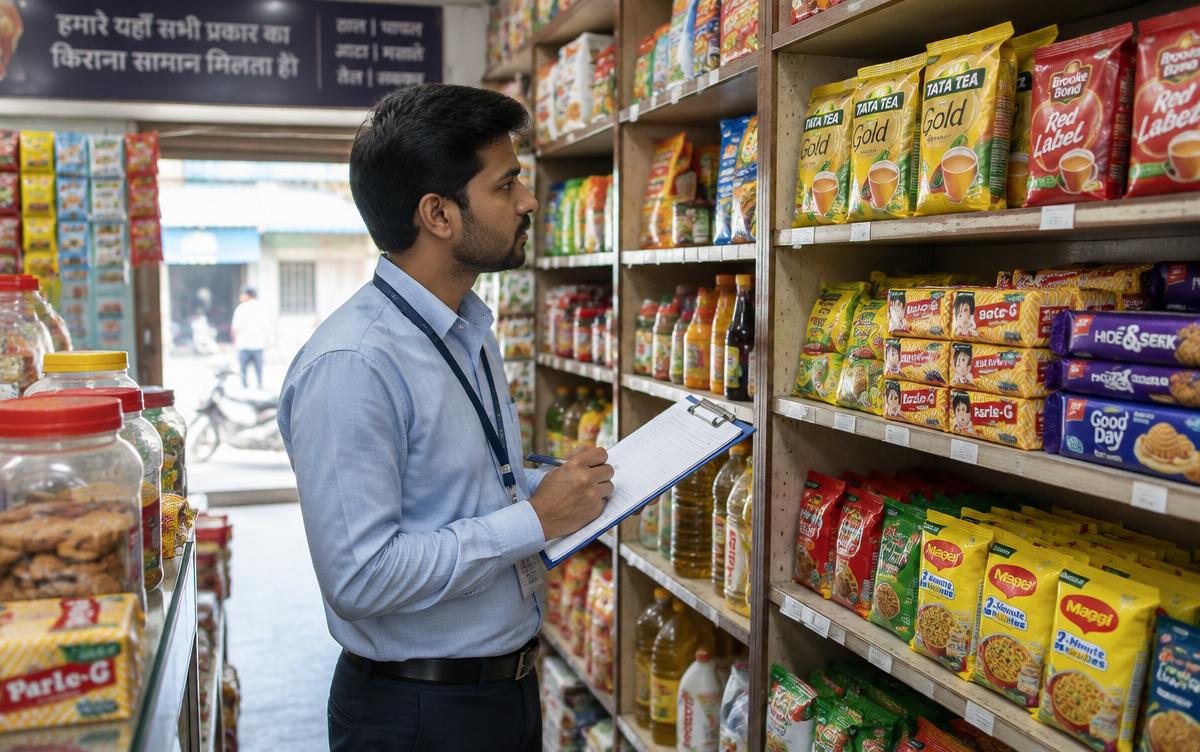
Auditors record stock, facings, pricing and point-of-sale material with geotagged shelf photographs against every entry.
- 4
Validate before processing
Entries are checked against photographs, prior-wave values and expected ranges. Outliers go back to the field before the data is accepted.
- 5
Report by channel and territory
Distribution, out of stock and visibility are reported at the cut your sales structure uses, so the number lands with an owner.
03
At a glance
Retail Audit & Distribution — typical study parameters
- Typical scale
- 200 to 3,000 outlets per wave across general trade, modern trade and emerging channels
- Fieldwork window
- Two to four weeks per wave, typically monthly or bi-monthly
- Lead time
- Panel construction takes two to three weeks for a first wave, then it is standing
- Coverage
- Kirana, chemist, modern trade, cash and carry and quick-commerce dark stores
- Languages
- Auditors work in the local trade language of each market
- Core methods
- Store census · Shelf audits · Distribution checks · Planogram compliance
- Reporting
- Numeric and weighted distribution, out-of-stock reporting and visibility scores by channel
- Best suited to
- Measuring what is actually on the shelf
04
What you receive
3 named deliverables, each written to be used rather than filed. Everything ships with the underlying data, so your team can keep working after the debrief.
Numeric distribution
Numeric and weighted distribution by SKU, channel and territory, trended against previous waves.
Out-of-stock reports
Out-of-stock reporting with the value of lost sales estimated and the responsible depot or beat identified.
Visibility scores
Share-of-shelf and visibility scoring with photographic evidence, so a compliance dispute with the trade can be settled.
05
How the fieldwork is validated
Fieldwork in India fails quietly when nobody checks it. These controls are run on every retail audit & distribution study, by a quality team that reports separately from the field team.
Geotagged photographic evidence
Every visit carries timestamped, location-tagged photographs, so any score can be re-checked against what the auditor actually saw.
Auditor profile matched to the outlet
Auditors match the outlet's real customer on age, language and apparent income, so staff behave as they would on any other day.
Same-day, locked submission
Reports are filed within four hours of the visit, before recall degrades, and the record is locked against later editing.
Ten per cent blind re-audit
A second auditor repeats a tenth of visits without seeing the first score. Gaps beyond tolerance trigger a review of that auditor's whole batch.
Panel continuity managed deliberately
When an outlet closes it is replaced with a like-for-like store and the substitution is reported, so a trend is never broken silently.
Method choice
Retail Audit & Distribution, or one of these instead?
Most briefs can be answered more than one way, and the wrong instrument is the most expensive mistake in research. Here is how retail audit & distribution compares with the two methods buyers most often weigh against it.
| Retail Audit & Distribution | Mystery Shopping | Consumer Research | |
|---|---|---|---|
| Best used for | Measuring what is actually on the shelf | Seeing what your customer actually experiences | Mapping and sizing demand across a whole category |
| Typical scale | 200–3,000 outlets | 100–2,000 visits | 800–2,400 interviews |
| Fieldwork window | 2–4 weeks per wave | 2–4 weeks per wave | 3–5 weeks |
| Evidence produced | Counted facts from a fixed outlet panel | Observed behaviour, with proof attached | Projectable numbers with segment stories behind them |
| Projects to a population | |||
| Relative cost | Scales with outlet count | Low per visit, scales with coverage | Mid to high |
Where this method stops
City coverage
Where this work is strongest
We field in all 50 cities, but these are the markets where this method has the most to offer — because of the infrastructure, the respondent base or the sectors concentrated there.
Tier 1 · Maharashtra
Mumbai
Dense modern-trade and chain footprint for repeat visits. Depth in Banking & Financial Services and Media & Entertainment, with work running in Marathi, Gujarati, Hindi and English.
ViewTier 1 · Delhi
Delhi NCR
Dense modern-trade and chain footprint for repeat visits. Depth in Government & Social Sector and Retail, with work running in Hindi, Punjabi and English.
ViewTier 1 · West Bengal
Kolkata
Dense modern-trade and chain footprint for repeat visits. Depth in FMCG and Logistics & Supply Chain, with work running in Bengali, Odia, Hindi and English.
ViewTier 1 · Tamil Nadu
Chennai
Dense modern-trade and chain footprint for repeat visits. Depth in Automotive and Manufacturing & Industrial, with work running in Tamil, Telugu, Kannada, Malayalam and English.
ViewTier 2 · Madhya Pradesh
Indore
Wide general-trade coverage plus the semi-urban belt around the city. Depth in FMCG and Education & EdTech, with work running in Hindi and English.
ViewTier 2 · Maharashtra
Nagpur
Wide general-trade coverage plus the semi-urban belt around the city. Depth in Logistics & Supply Chain and Agriculture & Agritech, with work running in Hindi and English.
ViewTier 2 · Uttar Pradesh
Lucknow
Wide general-trade coverage plus the semi-urban belt around the city. Depth in Government & Social Sector and Fashion & Apparel, with work running in Hindi, Punjabi and English.
ViewTier 2 · Gujarat
Surat
Wide general-trade coverage plus the semi-urban belt around the city. Depth in Fashion & Apparel and Manufacturing & Industrial, with work running in Marathi, Gujarati, Hindi and English.
View
Before you brief us
Frequently asked questions
How long does a retail audit & distribution project take?
Two to four weeks per wave, typically monthly or bi-monthly. Panel construction takes two to three weeks for a first wave, then it is standing. Analysis and reporting add a further one to two weeks, so most studies close inside six to ten weeks from brief to debrief.
What sample size do you recommend?
200 to 3,000 outlets per wave across general trade, modern trade and emerging channels. The right number is set by the smallest subgroup you need to report separately, not by a round figure, and we will say when a smaller sample would answer the question just as well.
What drives the cost of retail audit & distribution in India?
Incidence and audience difficulty first, then scale, the number of cities and languages, and the depth of reporting. Relative to other methods on this site, the cost profile is: scales with outlet count. Send a brief and you get a fixed-fee proposal within 24 hours.
When is retail audit & distribution the wrong choice?
An audit tells you what is on the shelf, not why a shopper walked past it. Pair it with shopper research for that.
How do you control quality in the field?
Every visit carries timestamped, location-tagged photographs, so any score can be re-checked against what the auditor actually saw. Beyond that, panel continuity managed deliberately: when an outlet closes it is replaced with a like-for-like store and the substitution is reported, so a trend is never broken silently.
Can international teams commission this from outside India?
Yes. We report in English, run calls across US, European and Asian time zones, and handle local-language fieldwork and translation end to end.
Study at a glance
- Discipline
- Specialist
- Typical scale
- 200–3,000 outlets
- Field window
- 2–4 weeks per wave
- Projectable
- Yes
- Relative cost
- Scales with outlet count
- Cities covered
- 50
Keep exploring
Everything built on this method
8 metros, 42 Tier 2 markets, 30 sectors and 15 guides, each applying retail audit & distribution to one specific context.
Tier 1 metros
8Full-scale fieldwork, viewing facilities and senior decision-maker access.
- Retail Audit & Distribution in MumbaiMaharashtra
- Retail Audit & Distribution in Delhi NCRDelhi
- Retail Audit & Distribution in BangaloreKarnataka
- Retail Audit & Distribution in ChennaiTamil Nadu
- Retail Audit & Distribution in HyderabadTelangana
- Retail Audit & Distribution in KolkataWest Bengal
- Retail Audit & Distribution in PuneMaharashtra
- Retail Audit & Distribution in AhmedabadGujarat
Tier 2 markets
42Each city covered from a local field base that also reaches the surrounding districts.
- Retail Audit & Distribution in JaipurRajasthan
- Retail Audit & Distribution in LucknowUttar Pradesh
- Retail Audit & Distribution in KanpurUttar Pradesh
- Retail Audit & Distribution in NagpurMaharashtra
- Retail Audit & Distribution in IndoreMadhya Pradesh
- Retail Audit & Distribution in BhopalMadhya Pradesh
- Retail Audit & Distribution in SuratGujarat
- Retail Audit & Distribution in VadodaraGujarat
Show 34 more
- Retail Audit & Distribution in RajkotGujarat
- Retail Audit & Distribution in NashikMaharashtra
- Retail Audit & Distribution in AurangabadMaharashtra
- Retail Audit & Distribution in CoimbatoreTamil Nadu
- Retail Audit & Distribution in MaduraiTamil Nadu
- Retail Audit & Distribution in KochiKerala
- Retail Audit & Distribution in ThiruvananthapuramKerala
- Retail Audit & Distribution in VisakhapatnamAndhra Pradesh
- Retail Audit & Distribution in VijayawadaAndhra Pradesh
- Retail Audit & Distribution in MysoreKarnataka
- Retail Audit & Distribution in MangaloreKarnataka
- Retail Audit & Distribution in Hubli-DharwadKarnataka
- Retail Audit & Distribution in ChandigarhChandigarh
- Retail Audit & Distribution in LudhianaPunjab
- Retail Audit & Distribution in AmritsarPunjab
- Retail Audit & Distribution in JalandharPunjab
- Retail Audit & Distribution in DehradunUttarakhand
- Retail Audit & Distribution in AgraUttar Pradesh
- Retail Audit & Distribution in VaranasiUttar Pradesh
- Retail Audit & Distribution in PrayagrajUttar Pradesh
- Retail Audit & Distribution in MeerutUttar Pradesh
- Retail Audit & Distribution in NoidaUttar Pradesh
- Retail Audit & Distribution in GurugramHaryana
- Retail Audit & Distribution in FaridabadHaryana
- Retail Audit & Distribution in GhaziabadUttar Pradesh
- Retail Audit & Distribution in PatnaBihar
- Retail Audit & Distribution in RanchiJharkhand
- Retail Audit & Distribution in BhubaneswarOdisha
- Retail Audit & Distribution in RaipurChhattisgarh
- Retail Audit & Distribution in GuwahatiAssam
- Retail Audit & Distribution in JammuJammu & Kashmir
- Retail Audit & Distribution in GoaGoa
- Retail Audit & Distribution in JodhpurRajasthan
- Retail Audit & Distribution in UdaipurRajasthan
By industry
30The same method applied to one sector’s audiences, vocabulary and buying process.
- FMCG retail audit & distribution
- Healthcare retail audit & distribution
- Pharmaceuticals retail audit & distribution
- Banking & Financial Services retail audit & distribution
- Insurance retail audit & distribution
- Automotive retail audit & distribution
- Electric Vehicles retail audit & distribution
- Real Estate retail audit & distribution
Show 22 more
- Education & EdTech retail audit & distribution
- Retail retail audit & distribution
- E-commerce & Quick Commerce retail audit & distribution
- Telecom retail audit & distribution
- Information Technology & SaaS retail audit & distribution
- Energy & Renewables retail audit & distribution
- Agriculture & Agritech retail audit & distribution
- Manufacturing & Industrial retail audit & distribution
- Hospitality & Tourism retail audit & distribution
- Food & Beverage retail audit & distribution
- Consumer Durables & Electronics retail audit & distribution
- Fashion & Apparel retail audit & distribution
- Media & Entertainment retail audit & distribution
- Logistics & Supply Chain retail audit & distribution
- Chemicals & Specialty Materials retail audit & distribution
- Construction & Infrastructure retail audit & distribution
- Beauty & Personal Care retail audit & distribution
- Fintech retail audit & distribution
- Gaming & Esports retail audit & distribution
- Aviation & Airports retail audit & distribution
- Medical Devices retail audit & distribution
- Government & Social Sector retail audit & distribution
Guides and pricing
15Cost drivers, briefing checklists and buyer guides written for this method.
- How Much Does Retail Audit & Distribution Cost in India? A Pricing Guide4 min
- Retail Audit & Distribution in India: The Complete Guide4 min
- How to Choose a Retail Audit & Distribution Agency in India4 min
- Retail Audit & Distribution Checklist: 12 Steps Before You Commission a Study4 min
- 7 Costly Retail Audit & Distribution Mistakes Brands Make in India4 min
- Retail Audit & Distribution Sample Size and Sampling Guide for India4 min
- How Long Does Retail Audit & Distribution Take? Project Timelines Explained4 min
- Retail Audit & Distribution for Foreign Companies Entering India4 min
Show 7 more
- Retail Audit & Distribution in Tier 2 and Tier 3 India: How to Get It Right4 min
- Retail Audit & Distribution for Startups: Getting Evidence on a Budget4 min
- How to Write a Retail Audit & Distribution Brief (Free Template)4 min
- In-House vs Agency Retail Audit & Distribution: Which Is Right for You?4 min
- Measuring the ROI of Retail Audit & Distribution4 min
- Retail Audit & Distribution by Industry: Use Cases from FMCG to Healthcare4 min
- Retail Audit & Distribution: 10 Questions to Ask Before You Hire a Research Firm4 min
Other specialist methods
2Closest alternatives, where a different instrument may answer the question better.
Every other service
17The full method set, from qualitative immersion to strategic modelling.
- Consumer ResearchQuantitative
- B2B Market ResearchStrategy
- Focus Group DiscussionsQualitative
- In-Depth InterviewsQualitative
- Quantitative SurveysQuantitative
- CATI Telephone SurveysQuantitative
- Online SurveysQuantitative
- Market Feasibility StudiesStrategy
Show 9 more
- Competitor AnalysisStrategy
- Brand Health TrackingQuantitative
- Customer Satisfaction & NPSQuantitative
- Product & Concept TestingQuantitative
- Pricing ResearchStrategy
- Market Sizing & ForecastingStrategy
- Ethnographic ResearchQualitative
- Usage & Attitude StudiesQuantitative
- Advertising & Media ResearchQuantitative
Next step
Ready to scope a retail audit & distribution study?